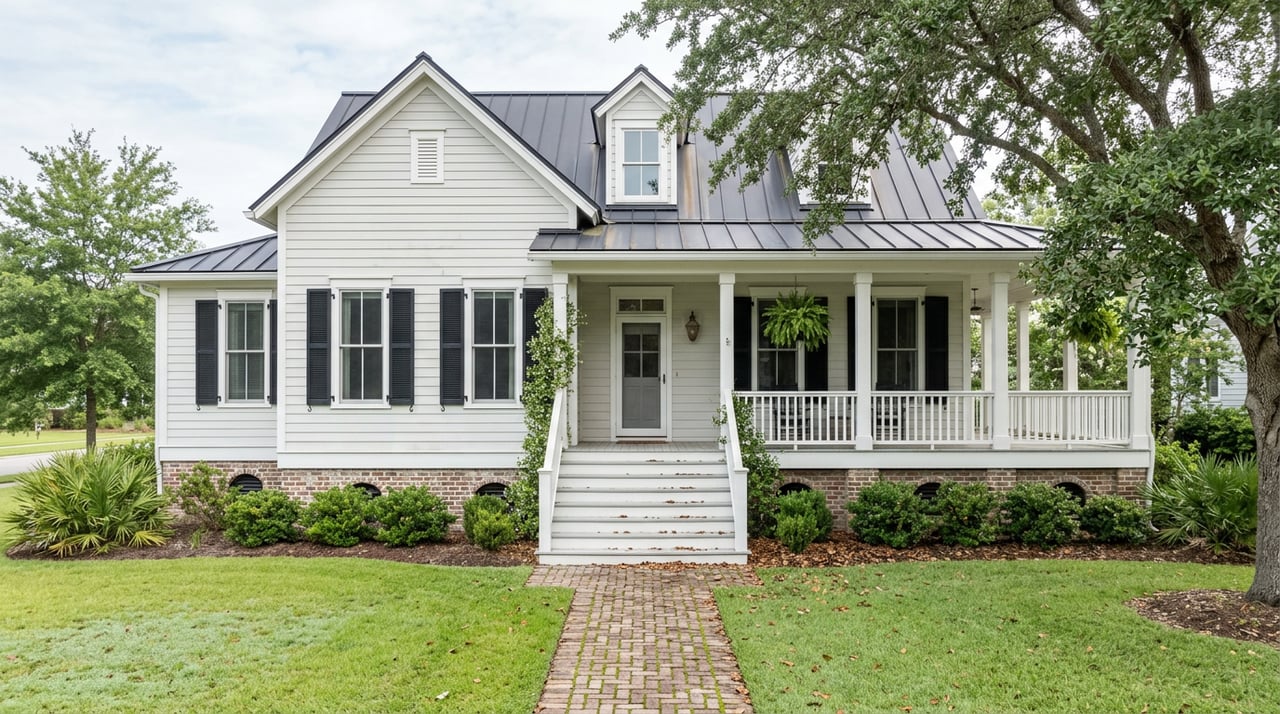
Bay St. Louis Real Estate Market by Neighborhood: Four Distinct Markets
September 24, 2026
September 24, 2026
If you pulled up Bay St. Louis housing data this month, you saw two numbers that shouldn't exist together. The average time to sell in June 2026 was 111.5 days, among the slowest readings on the coast. At the same time, homes that actually closed sold for a median of $399,000 against a median asking price of $419,000 across active listings, a gap of roughly five percent. That's tight. In a market where sellers were losing leverage, you'd expect closed prices to be falling well below what's being asked. That isn't what's happening here.
Those two facts can't both be explained by "the market is cooling." Something else is producing that 111-day average, and once you see it, you'll read every Bay St. Louis listing differently.
Start with what MLS United's residential sales data actually showed for June 2026: 173 homes actively listed against just 28 closings, a ratio equal to about 6.2 months of supply. That's a slow-moving market by any measure. But the same report placed Bay St. Louis as the second most expensive market among the coastal cities it tracked, trailing only Pass Christian, with a median sold price sitting roughly $150,000 above Diamondhead's and nearly triple Pascagoula's.
This isn't a one-month blip. Redfin's data showed the median sold price at $375,000 in August 2025, down 4.2 percent year over year, with the average time to sell climbing to 105 days from 80 days the year before. By May 2026, Redfin's median sale price had moved to $384,770, up 4.1 percent year over year. Movoto's September 2026 figures put the median list price at $395,000, essentially flat compared to both August 2025 and September 2025, while active listings were sitting a median of 150 days, a 3 percent improvement from a year earlier but still long by regional standards.
Prices aren't collapsing. Days on market keeps climbing, then easing slightly, then climbing again. If you're comparing Bay St. Louis to a neighboring town using any single one of these numbers, you're missing the reason they all disagree with each other.
The citywide average blends property types that don't sell to the same buyer, on the same timeline, for the same reasons.
The first is standard single-family resale, the three-bedroom, two-bath houses in pockets like Chapel Hill and Carroll or Choctaw Oaks that draw a broad, straightforward buyer pool. This is the segment that moves fastest. For comparison, homes in Long Beach, about 40 minutes east on Highway 90, were closing in roughly a quarter of the time Bay St. Louis listings were taking, largely because Long Beach's inventory skews more heavily toward this exact kind of resale.
The second is waterfront and Old Town premium product: raised cottages a few streets off Main Street, canal-front lots in Riverview with bulkheaded frontage feeding into Bayou LaCroix and Catahoula Creek toward the Jourdan River, and family homes in Jourdan River Estates built around private boat launches and river access. This segment carries the price premium that makes Bay St. Louis the second most expensive market on the coast, but it draws a smaller, more selective pool of buyers who are shopping for a specific setting rather than a floor plan. That's the segment doing most of the work in stretching the average days-on-market number.
The third is brand-new construction, and right now that means Farragut Lofts in the heart of Old Town. The building's fifteen residential units come with Fisher & Paykel appliances, Brazilian quartzite countertops, encaustic cement tile, and Kohler cast iron fixtures, with a saltwater pool that was planned for summer 2026 and ground-floor commercial space anchored by Full Speed Patio & Lounge. A deeded-parking condo with resort amenities doesn't compete for the same buyer as a 1930s cottage three blocks away, but both get filed under "Old Town" when someone reports a single median for the neighborhood.
The fourth is unplatted land, recorded in the MLS as Metes and Bounds. A meaningful share of Hancock County inventory falls into this category: acreage and waterfront parcels with no subdivision plat, priced on frontage, bulkhead condition, and elevation rather than on comparable house sales. A forty-acre river-frontage parcel waiting for the right buyer with the right plans can sit for months and drag the citywide days-on-market average exactly the way a slow-moving waterfront estate does, even though nothing about it compares to a three-bedroom house.
Here's how those four buckets actually behave:
| Segment | What's for sale | Typical buyer | What drives the price |
|---|---|---|---|
| Standard resale | 3-4BR homes in Chapel Hill, Carroll/Choctaw Oaks | First-time and move-up buyers | Comparable house sales |
| Waterfront & Old Town | Cottages, Riverview and Jourdan River Estates lots, Shoreline Park and Clermont Harbor waterfront | Lifestyle and second-home buyers | Setting, water access, walkability to Old Town |
| New construction condo | Farragut Lofts units | Primary, second-home, and short-term rental buyers | Finish level and building amenities |
| Unplatted acreage | Metes and Bounds parcels | Builders, investors, land buyers | Frontage, elevation, bulkhead condition |
Average those four together and you get a number that describes none of them accurately.
Part of the confusion buyers run into is that different data sources aren't even measuring the same thing. Zillow's home value index put the typical Bay St. Louis home at $230,250 as of the end of May 2026, up 6.3 percent over the year. That figure is a smoothed estimate across the entire housing stock, including homes that never listed, not a snapshot of what actually closed. Movoto's active-listing days-on-market figure measures how long homes currently for sale have been sitting, which is a different calculation than MLS United's average time to close on completed sales. Redfin's median sale price and Zillow's typical value answer different questions entirely.
None of these numbers is wrong. They're measuring different slices of the same mixed inventory, using different math, at different moments. That's exactly why a single "Bay St. Louis median" pulled from any one site is a poor tool for pricing a specific listing or sizing up a specific offer.
Go back to the number that started this: a roughly five percent gap between June 2026's median asking price and median sold price. In a market where sellers were overreaching, you'd see that gap widen, with homes closing well under list and sellers chasing the market down. That's not what the spread shows.
What it shows is that the homes which do sell in Bay St. Louis are priced close to where the market actually is. The slowness isn't a pricing problem. It's a buyer-pool problem concentrated in the segments where the buyer pool is naturally smaller: waterfront, near-water, and Old Town inventory, plus land that only makes sense to a narrow set of buyers with specific plans. A market can be entirely healthy and still average out to a long days-on-market number if a large enough share of what's for sale only appeals to a narrow slice of buyers looking for exactly that setting.
If you're weighing Bay St. Louis against another Gulf Coast town, or against another Bay St. Louis listing, the citywide figures are a starting point, not an answer. A better approach:
For sellers, this means a home sitting at 150 days isn't automatically evidence of a soft market. It's far more often a home priced against the wrong comp set for its segment. For buyers and investors, it means the patience required in one Bay St. Louis pocket may not apply three blocks away.
A single "Bay St. Louis median" hides more than it reveals in a city with this much variation in its housing stock. The number worth trusting isn't the citywide average. It's the comp set built around the specific pocket, property type, and buyer pool your listing actually belongs to.
If you're trying to make sense of what a specific Bay St. Louis address is really worth, or you want eyes on how your own home compares to what's moving in its actual segment, Glenn-Marie Fitzgerald can walk through the comps that matter for your pocket of town. Get Your Home Value — Start Here.
Stay up to date on the latest real estate trends.
Get assistance in determining current property value, crafting a competitive offer, writing and negotiating a contract, and much more. Let me guide you through your home-buying journey.
GLENN-MARIE FITZGERALD
2137 E PASS RD GULFPORT MS 39507